The Mathematical Probability of Retention Dropping After Four Minutes of Video
Video has become a central medium for learning, communication, and entertainment. Yet one of the persistent challenges in online video design is sustaining viewer attention. Empirical evidence from multiple fields suggests that viewer retention declines as video length increases, and that there are identifiable points in the viewing timeline where drop-off becomes more likely. This blog post examines the probabilistic nature of retention decline around the four-minute mark and situates these patterns in both educational and broader media contexts.
Defining Retention and Drop-Off in Video Viewing
In the context of online video, retention refers to the portion of viewers who continue watching a video over time. Platforms like YouTube and learning analytics dashboards visualize retention as a curve showing the percentage of viewers still watching at each moment. Drop-off points are time intervals where a disproportionately large portion of the audience stops watching.
Retention dynamics are not random but reflect cognitive processes such as attention span, information-processing load, and viewer motivation. While the literature does not converge on a single mathematical function governing retention for all videos, several consistent patterns emerge, indicating that retention declines more steeply as videos grow longer. Content type, pacing, and relevance moderate these effects.
Empirical Patterns in Retention by Video Length
Quantitative data from industry reports and academic sources indicate that average viewer retention declines as video duration increases. For example, a benchmark analysis of a large corpus of online videos found:
- Videos shorter than 1 minute typically retain around 68% of their audience.
- Videos 1–2 minutes long retain about 56%.
- Videos 2–5 minutes long retain around 47%.
- Videos 5–10 minutes long retain about 37%.
- Videos longer than 10 minutes retain progressively fewer viewers.
This gradient shows an inflection in retention around the 2–5 minute range, with a particularly noticeable retention decline when surpassing the 4-minute threshold.
Another study in a flipped classroom context found that videos under 5 minutes had higher viewer continuation scores and lower early drop-outs than longer videos (Gutiérrez-González et al., 2025). Specifically, metrics like engagement index and embedded question response rates were higher for videos shorter than 4–5 minutes, suggesting that viewer attention and participation decrease after this point.
Mathematical Models and Probability of Drop-Off
Although few studies provide explicit mathematical models of viewer retention, the observed patterns align with shapes that resemble negative exponential or logarithmic decay curves. These models are common in cognitive science for describing how attention or memory declines over time in the absence of new stimuli.
In a basic exponential model of attention decay:where:
- R(t) is the retention rate at time t,
- R0 is the initial retention rate,
- k is a decay constant reflecting how quickly viewers disengage.
This type of curve predicts that retention drops quickly in early moments and then declines more gradually thereafter. Research on video drop-out behavior supports this pattern: when retention is graphed over time, the steepest decline often occurs within the first few minutes, tapering off as the remaining viewers are more committed to watching through to the end.
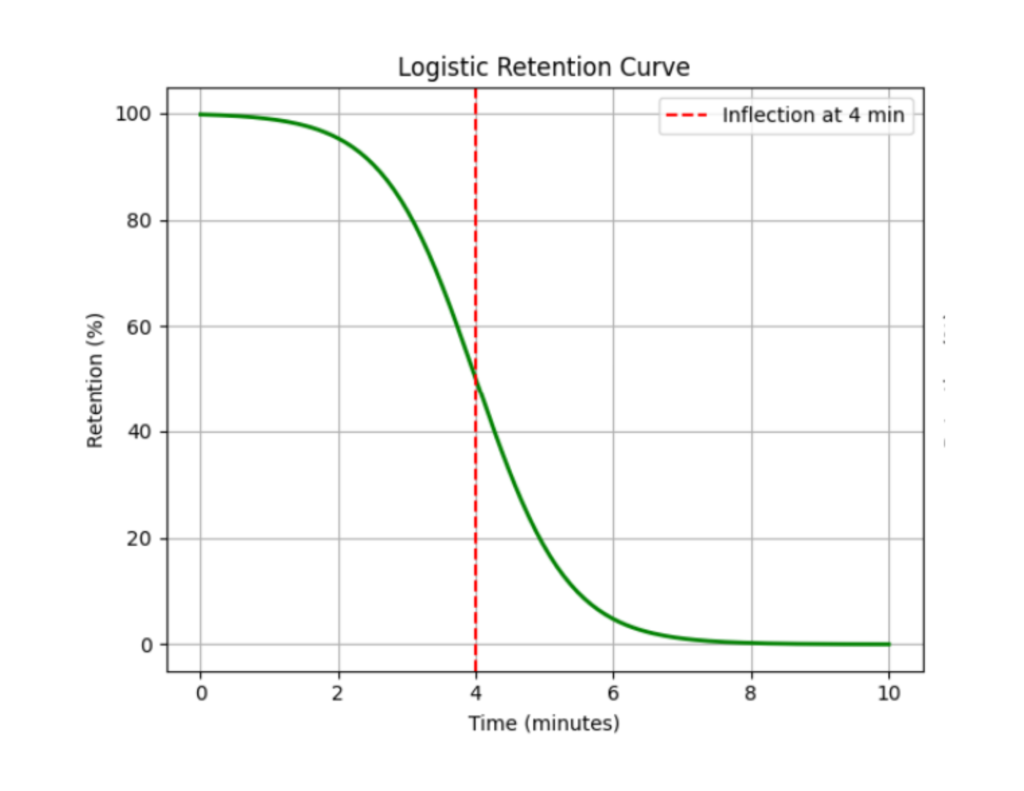
A logistic or sigmoidal model can also describe retention:This model has a more pronounced inflection point, where the probability of retention sharply changes around a critical time point (e.g., t₀ at 4 minutes). This captures the observation that viewer drop-off accelerates after certain lengths of video unless content strategy changes (e.g., adding interactive elements, visual changes).
Although these equations are simplifications, they provide a useful conceptual framework for understanding decline in viewer retention and for calculating the likelihood that a given viewer will still be watching at or beyond specific times.
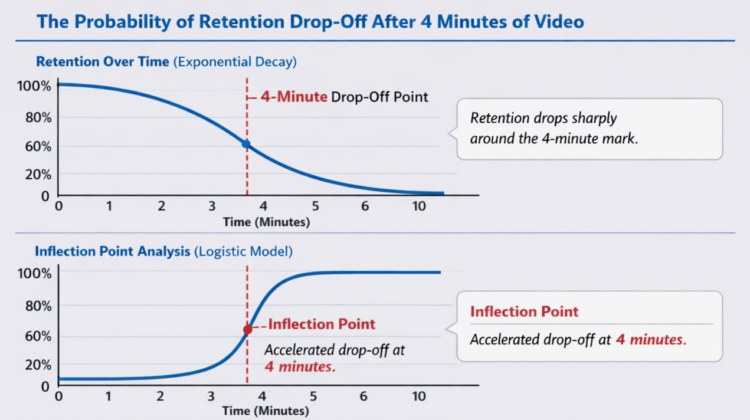
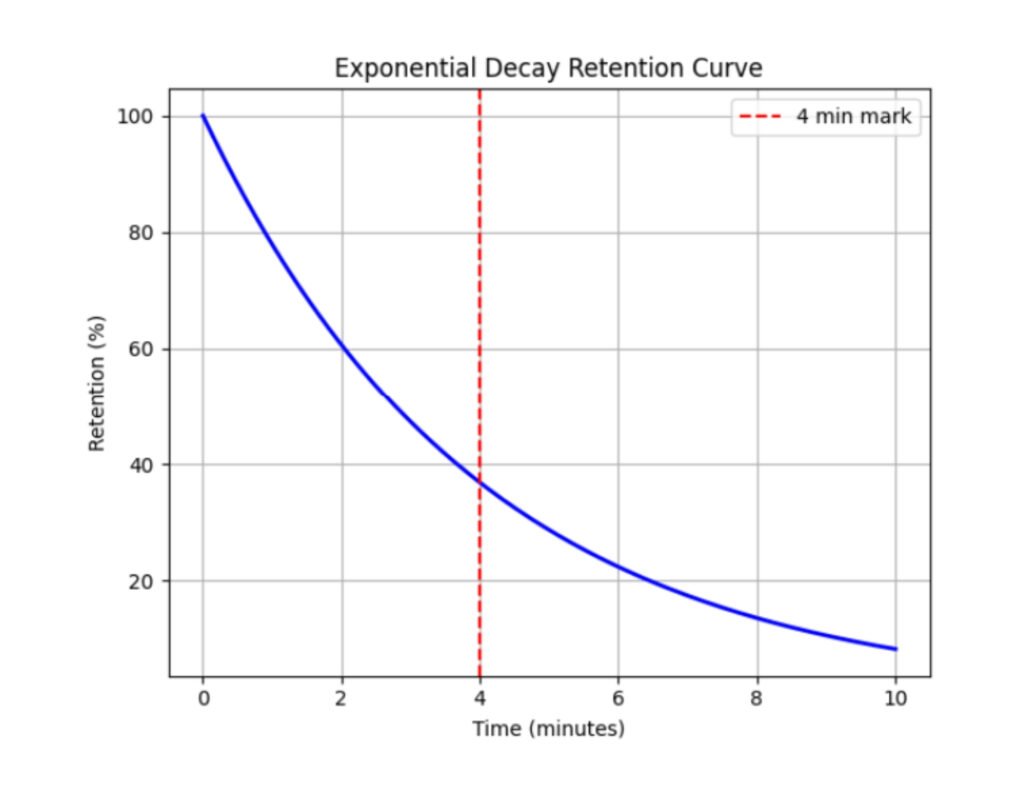
1. Retention Curve (Exponential Decay)
Concept: This shows the percentage of viewers remaining over time. Early minutes usually see the steepest decline.
Equation: = time in minutes
= initial retention (e.g., 100%)
= decay constant (determined empirically, e.g., 0.2)
2. Retention Inflection Point (Logistic Model)
Concept: Shows the point (around 4 minutes) where the probability of drop-off accelerates.
Equation:
- = inflection point (here, 4 minutes)
- = slope of drop-off
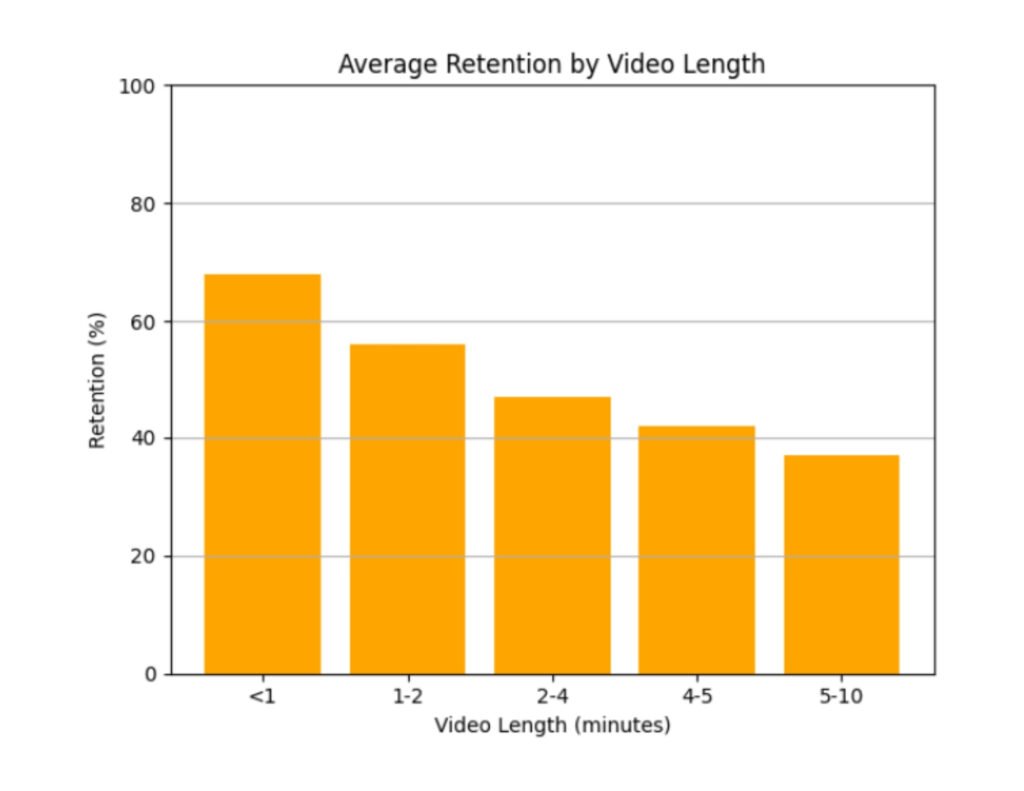
3. Retention by Video Length (Bar Chart)
Concept: Compare average retention for different video lengths.
| Video Length | Retention (%) |
|---|---|
| <1 min | 68 |
| 1–2 min | 56 |
| 2–4 min | 47 |
| 4–5 min | 42 |
| 5–10 min | 37 |
Cognitive and Contextual Drivers of Drop-Off
The probability of retention dropping after four minutes is not purely a function of length. Cognitive factors play a role. Sustained attention over extended periods is cognitively demanding, particularly when viewing content that requires deep processing (e.g., complex explanations or slower pacing). Research on attention in educational video contexts supports the idea that engagement is influenced by cognitive load and the visual complexity of content, which can increase pauses and drop-outs (Gritz et al., 2025).
Another factor is the changing attention span in digital environments. Contemporary audiences, especially on social platforms, often exhibit short attention spans and quick context switching, which can degrade retention on longer videos absent compelling structure or segmentation.
Practical Implications for Learners and Designers
For instructional designers, the evidence on retention curves has implications:
- Segmenting content into shorter chunks (e.g., micro-lectures of 3–4 minutes) can increase the probability that learners will watch through the entirety of instructional content.
- Introducing interactive questions or visual shifts at strategic intervals can counteract drop-off tendencies by reengaging attention.
- Aligning cognitive load with video pacing ensures that learners are not overwhelmed by dense information without sufficient processing time.
The goal is not simply to minimize length, but to maximize effective engagement. This often means balancing depth of content with structural cues that maintain attention.
Conclusion
The empirical evidence suggests that retention on online videos declines as a function of time, with a notable inflection point around four minutes, where drop-off becomes more probable. While exact mathematical probabilities depend on content, audience, and context, conceptual models like exponential decay and logistic functions help frame how retention changes over time. For instructional designers, understanding these patterns can inform how video content is structured to support learner retention and engagement.
References
- Gritz, W., Salih, H., Hoppe, A., & Ewerth, R. (2025). From formulas to figures: How visual elements impact user interactions in educational videos. https://arxiv.org/abs/2505.01753
- Gutiérrez-González, R., Royuela, A., & Zamarron, Á. (2025). Student engagement and optimal video length in flipped classrooms. Journal of Medical Education. https://doi.org/10.1080/10872981.2025.2479752
- Why consumer attention drops off with longer online video content. (2025). NewMediaAndMarketing.com. https://www.newmediaandmarketing.com/why-consumer-attention-drops-off-with-longer-online-video-content/
- Chiossi, F., Haliburton, L., Ou, C., Butz, A., & Schmidt, A. (2023). Short-form videos degrade our capacity to retain intentions.
https://doi.org/10.48550/arXiv.2302.03714
Focus to learn more